Introduction
In RatedPower users can define a revenue profile for the energy selling over the lifetime of the pv plant. Thus, RatedPower will generate a detailed financial report, providing users with the necessary tools to assess the economic viability and profitability of their projects.
Financial Analysis Tab
By default, when creating any design from scratch, RatedPower uses predefined values within the different fields in order to generate results for the Financial Analysis of the pv plant.
The new ‘Financial’ tab brings all the economical parameters together to let the user customize their analysis. It is organized in different sections:
- In the ‘CAPEX’ section, RatedPower will automatically select as an input, a CAPEX template with all the prices extracted from IRENA for your specific project's location.
Within that template, you can edit the currency, reference unit (among all the units accounted by the software), price per unit and even a tax percentage. We can also change each entry's visibility, i.e. include or hide it in the financial report.
Once any changes have been applied to a template, user can overwrite it by clicking on ‘Save changes’ or create a new template by clicking on the ‘Save new template’ button. Also undo changes or delete a template is enabled by clicking on the ‘Reset’ button or the bin icon, respectively.

If you have modified a template within the design process but have not saved it as a new template, RatedPower will keep a copy of the modified version. If you clone a design with modified CAPEX entries, the cloned design will have the same modifications. RatedPower will display a ‘modified’ label next to the CAPEX template name as a warning.
If you want to explore all the different templates available in our database, modify an existing one or simply create your own template from scratch, you can follow this article ‘How to create a CAPEX template’.
- Under the ‘OPEX’ section, user can define the annual operating costs of the PV plant [m.u/MWp] together with a year-on-year scaling factor to increase or decrease them.
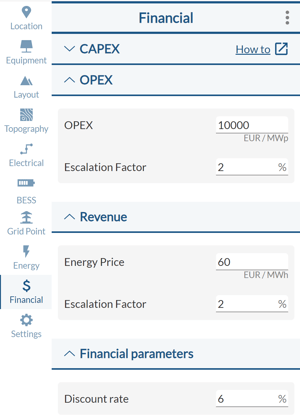
- In parallel, in the ‘Revenue’ section, user can define a fixed annual price for the energy selling [m.u/MWh injected] to calculate the annual revenues. You can also add a year-on-year scaling factor.
- Finally, in the ‘Financial Parameters’ section, user can define the discount rate to be used to calculate all the financial indicators.
Please note that, besides defined annual OPEX, RatedPower will consider the purchase of energy consumed by the plant as well as an expense. To do so, it will use the same fixed price [m.u/MWh consumed] previously defined by the user under the 'Revenue' section.
Results
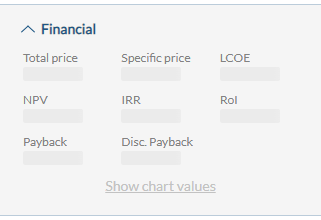
All the values provided above will allow you to get results for each iteration, not only for the initial investment (CAPEX), the specific price or even the Levelized Cost of Energy (LCOE) but also for generating different investment analysis indicators such as: NPV, IRR, Payback Period, Updated Payback Period and ROI as well as some charts.
The following Glossary defines the main elements used in the formulas for calculating all financial indicators:
- CAPEX: is the capital expenditure. It refers to the investment cost required to develop the project.
- OPEX: stands for operating expenses. It refers to the cost required to make sure the pv plant is working properly throughout its entire lifetime. It includes the fixed operating costs introduced by the user [m.u/MWp] as well as the purchase costs for the nighttime consumed energy [m.u/MWh consumed].
- Energy: is the annual energy injected to the grid produced by the photovoltaic plant.
- n: is the total number of operation years. This parameter reflects the lifetime of the PV plant.
- r: is the discount rate.
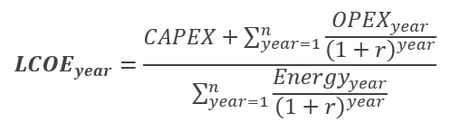
Levelized Cost of Energy (LCOE)
The levelized cost of energy (LCOE) is a measure of the average net present cost of electricity generation for a generator over its lifetime.
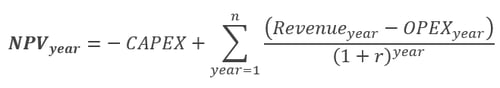
Net Present Value (NPV)
The net present value (NPV) of a PV plant is the difference between the present value of the revenue from selling the energy produced and the present value of all the operating costs over a certain period of time.
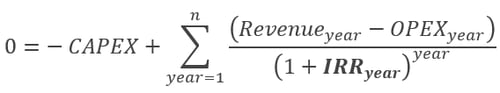
Internal Rate of Return (IRR)
The Internal Rate of Return (IRR) is a financial indicator used to measure the profitability of a potential investment. IRR reflects the discount rate that makes the net present value (NPV) equal to zero for a given period of time.
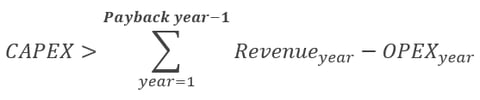
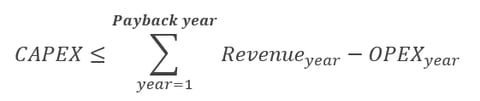
Payback Period
The Payback Period refers to the number of years it takes to recover the initial investment (CAPEX) of the PV plant.
The year in which this initial investment is recovered must verify the following inequations system:
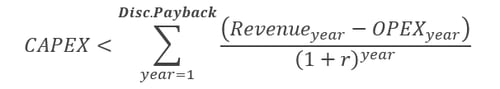
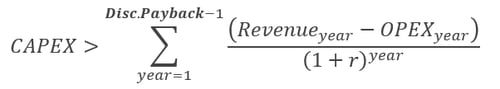
Discounted Payback Period
The Discounted Payback Period refers to the number of years it takes to recover the initial investment (CAPEX), discounting future cash flows and taking into account the time value of money.
The following inequations system must be verified:
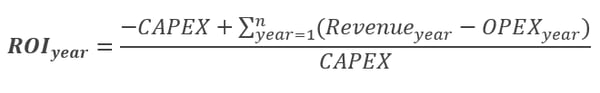
Return on Investment (ROI)
Return on Investment (ROI) is a ratio that reflects the return on the PV plant's net income from the energy selling over a period of time versus the costs for the initial investment (CAPEX) and operation and maintenance (OPEX) throughout its lifetime.
Documents
Apart from all the main financial indicators shown in the graphical interface, RatedPower has enhanced and expanded the ‘Financial Analysis’ document.
This document now shows the detailed calculation of each financial indicator, providing the user enough tools to carry out a complete profitability and economic feasibility analysis. Besides, it also provides the user some charts of those main financial KPIs.
Some other financial KPIs that you can find in this document are:
- EBITDA (Earnings Before Interest, Taxes, Depreciation and Amortization)- Free Cash Flow (FCF)
- Cumulative Free Cash Flow (CFCF)
- Discounted Free Cash Flow (DFCF)
- Discounted Cumulative Free Cash Flow (DCFCF)
The structure followed in this document is divided into 4 Excel sheets:
- A BOQ sheet with all accounted units of the plant that have been used for the CAPEX calculation.
- A Financial Analysis sheet with the annual projection of all those financial KPIs, both in data table and chart format.
- An Hourly Revenue sheet with energy purchase and energy selling prices, as well as the yearly profits.
- An OPEX sheet including all the operating costs (manually defined by the user) as well as the yearly costs of purchasing the pv plant consumed energy.
Summary
As you can see, within RatedPower you can now select a cost template and define a fixed price for the energy selling. This will allow you to use all available pv plant units on each simulation to calculate, not only the CAPEX, the specific price or even the LCOE, but also a detailed Financial Report.
Therefore, you can evaluate the economic feasibility and profitability of each design and, consequently, of your project.
For any other questions or for more information regarding the financial analysis tab and the results that RatedPower provides to evaluate the economic feasibility of your project, please contact us at the following email address: support@ratedpower.com