New grouping algorithm, custom elevation data
pvDesign - version 3.6.2
In December we made big changes to one of the core components of pvDesign, the grouping algorithm which selects structures for each power station. Find below a description of the new features:
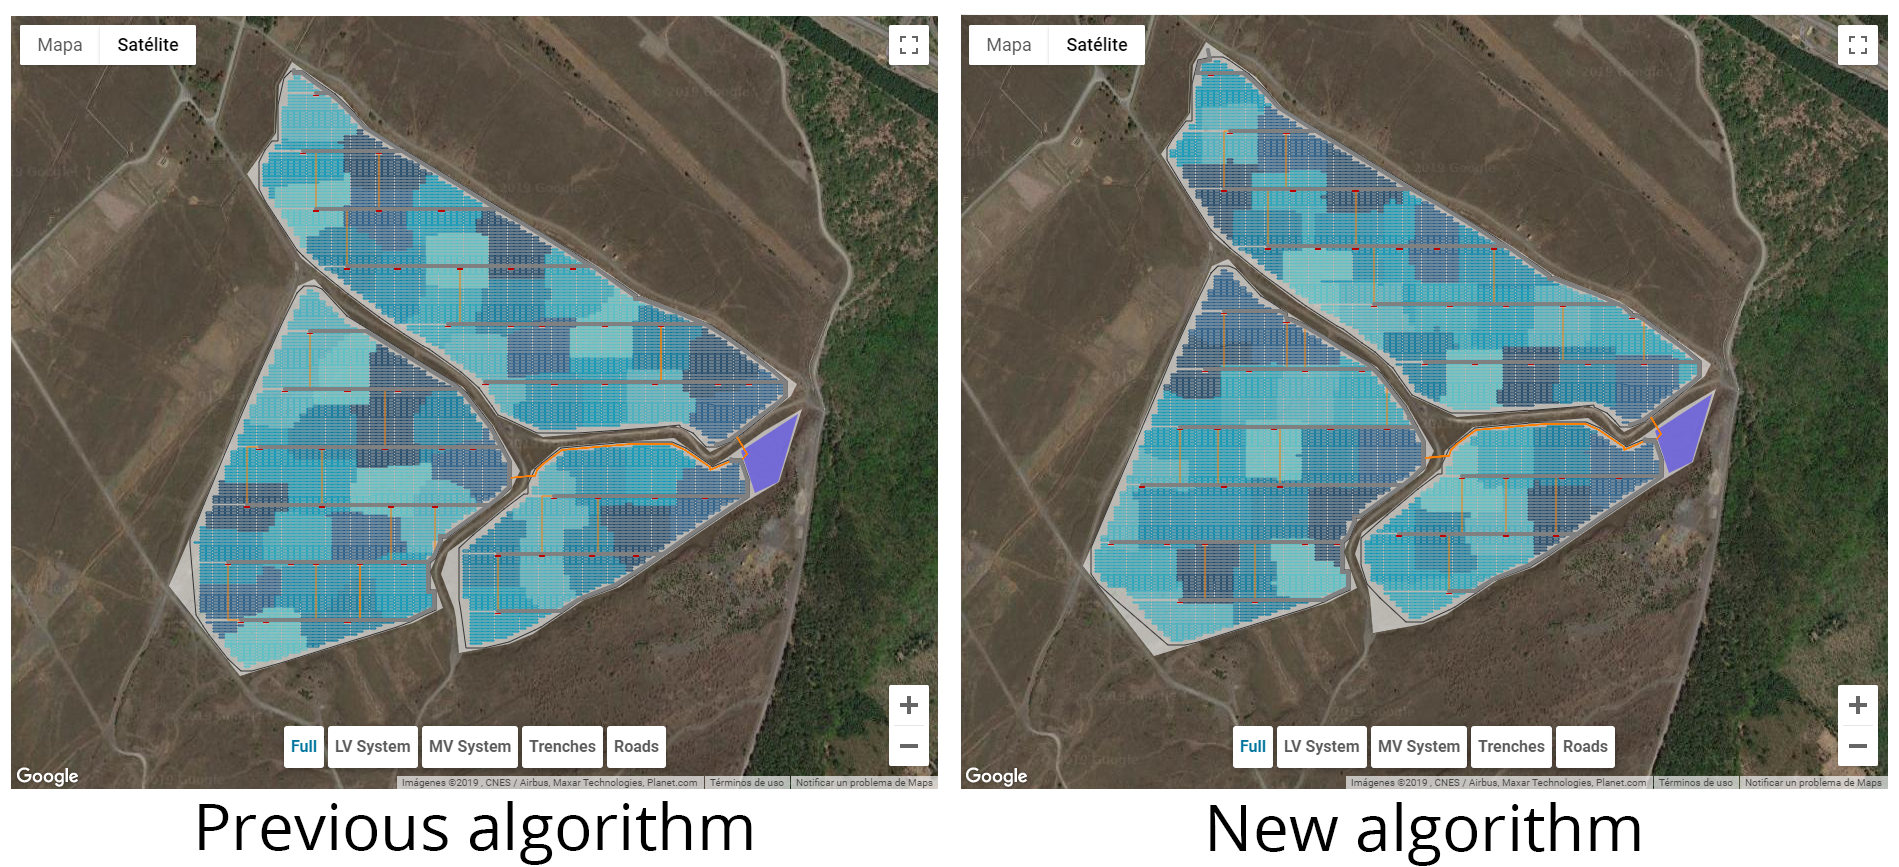
- New grouping algorithm: The algorithm which defines the groups of structures which make up a power station was remade. We wanted to solve some important issues the previous version of the algorithm had, and improving the performance in big PV plants was an objective. The new algorithm is less likely to split power stations, and it yields more squared shapes. It is also much faster than the previous algorithm, which should result in reduced simulation times.
- Custom elevation data: It is now possible to upload custom elevation data, as a CSV file with elevation data points in UTM coordinates. Using an inverse distance weighting interpolation algorithm, pvDesign will generate a mesh of points using the uploaded data, which will be used to compute the slopes. Soon we will add tutorials and other content to help users get the most out of the feature.

- Download elevation data: Users can now download elevation data as a CSV file. The data can be downloaded in the New Design - Site Details tab, clicking the details button of a topography card.
- Improved energy PV module degradation model: We changed the degradation model of the PV module in the energy simulation to better reflect how manufacturers define warranty specifications. Users can now specify a degradation value for the first year which may be different to the value of subsequent years.
- Fixed minimum historical temperature: We removed a safety factor which was used when computing the minimum historical temperature used in New Design. The temperature value should now match the minimum value of the hourly data values.
The following improvements and bug fixes were made:
- We disabled the layout Google Maps view for PV plants if the number of elements exceeds a threshold, to avoid situations where the users browser may hang. Users can still download the layout in PDF, DXF or KML formats.
- We fixed a bug which caused the meteorological data cards to appear twice in New Design.
- We fixed a bug in the layout generation which was causing some simulations to fail.