Learn what P50 or P90 means and how does it relate to the uncertainty of your meteorological data.
Introduction
When you create a design in RatedPower, the software performs an energy yield calculation for you. It calculates how much energy your PV plant will produce during its lifespan. The first energy result that you will encounter once a design is generated is "Energy". This value is the amount of energy that your facility will produce during the 1st year of operation.
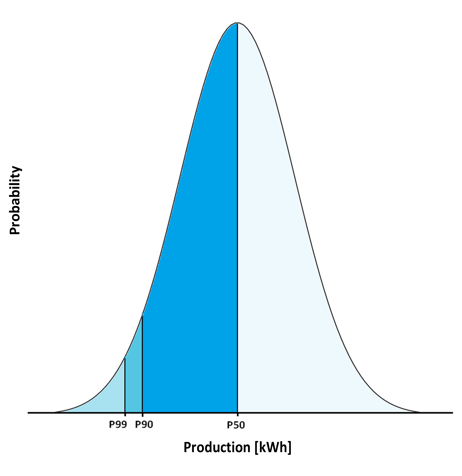
When calculating the energy yield, for simplicity and statistical analysis, we assume that the weather values are normally distributed (a bell-shaped curve). This is a common simplification used in most energy models.
This statistical analysis is identified with a parameter indicating the confidence interval. The parameters P50 (or P90, etc.) are probabilistic values. The P50 value corresponds to the annual production level that is expected to be exceeded with a 50% probability. The P90 value corresponds to the annual production level that should be exceeded with a 90% probability.
Our model will calculate your energy yield using a TMY file. This TMY should be considered as an average and thus corresponds to P50.
P50 represents the "best estimate" but in some cases, you can need a prediction with lower risk, like the P90 (estimate exceeded with 90 % probability) or P99 (estimate exceeded with 99 % probability).
The amount of energy yield for P90 will be lower than for P50, since it's a more conservative estimation. Usually, this value is requested for financial purposes. For example, when studying the debt structure.
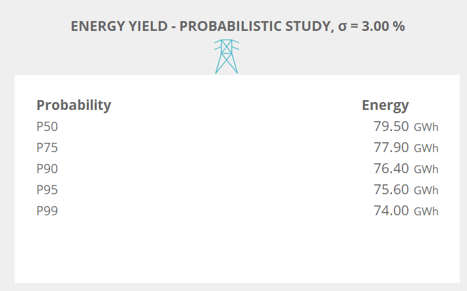
This is why RatedPower will evaluate your energy yield for the following probabilities: P50, P75, P90, P95, and P99. These values are available in the Energy Yield Report as well as the Energy Yield Results (first tab of the excel sheet).
These values are calculated based on the interannual variability you select during your design. Go to the "Energy" tab in RatedPower, and find the input under "Simulation".
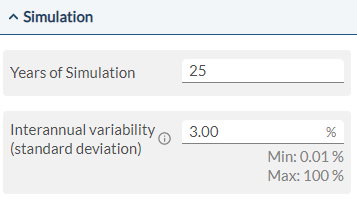
The value you insert will be the standard deviation of your data.
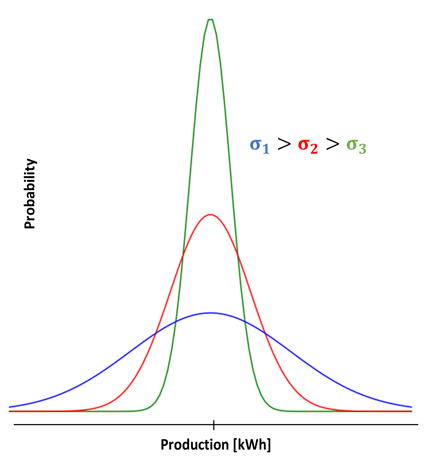
The standard deviation (sigma) will define how much your data varies around the average value. The lower your sigma, the more narrow the Gauss bell will be.
This value is a percentage and it represents all the sources of uncertainty such as:
- Interannual variability: the TMY gives you a representative year, a 'typical' year, but your meteorology varies from one year to another. This measures how much it can vary, and how unstable the weather is. This is the main source of uncertainty and the one that gives the name to the input.
- Uncertainty of the meteorological data model: the admissible error of the methodology used to calculate the GHI.
- Uncertainty of the energy simulation model: the admissible error of the methodology used to calculate the energy yield: estimation of the equipment performance, the losses, etc.
For more information regarding this topic, you can contact the Support team at support@ratedpower.com